Gamifying Security with Red Team Scores
Security metrics are an interesting topic.
Over the years I used “scores” as a tool to identify and shine light on problematic areas or highlight lack of engineering and security quality of certain teams.
A security score should not seen as an objective or absoulte measure, but it allows to compare systems with each other at a relative scale, and by sharing the score it makes people ask questions.
I have seen showing management ask vivid questions when they see a chart with their service and a score next to it:
“Why does my Billing Service have a higher score than Joe’s Signup Service?”
This is great, as it opens the floor up for discussions!
Let me give you a brief introduction on a rather simple scoring method.
Gamifying security with scaled scores
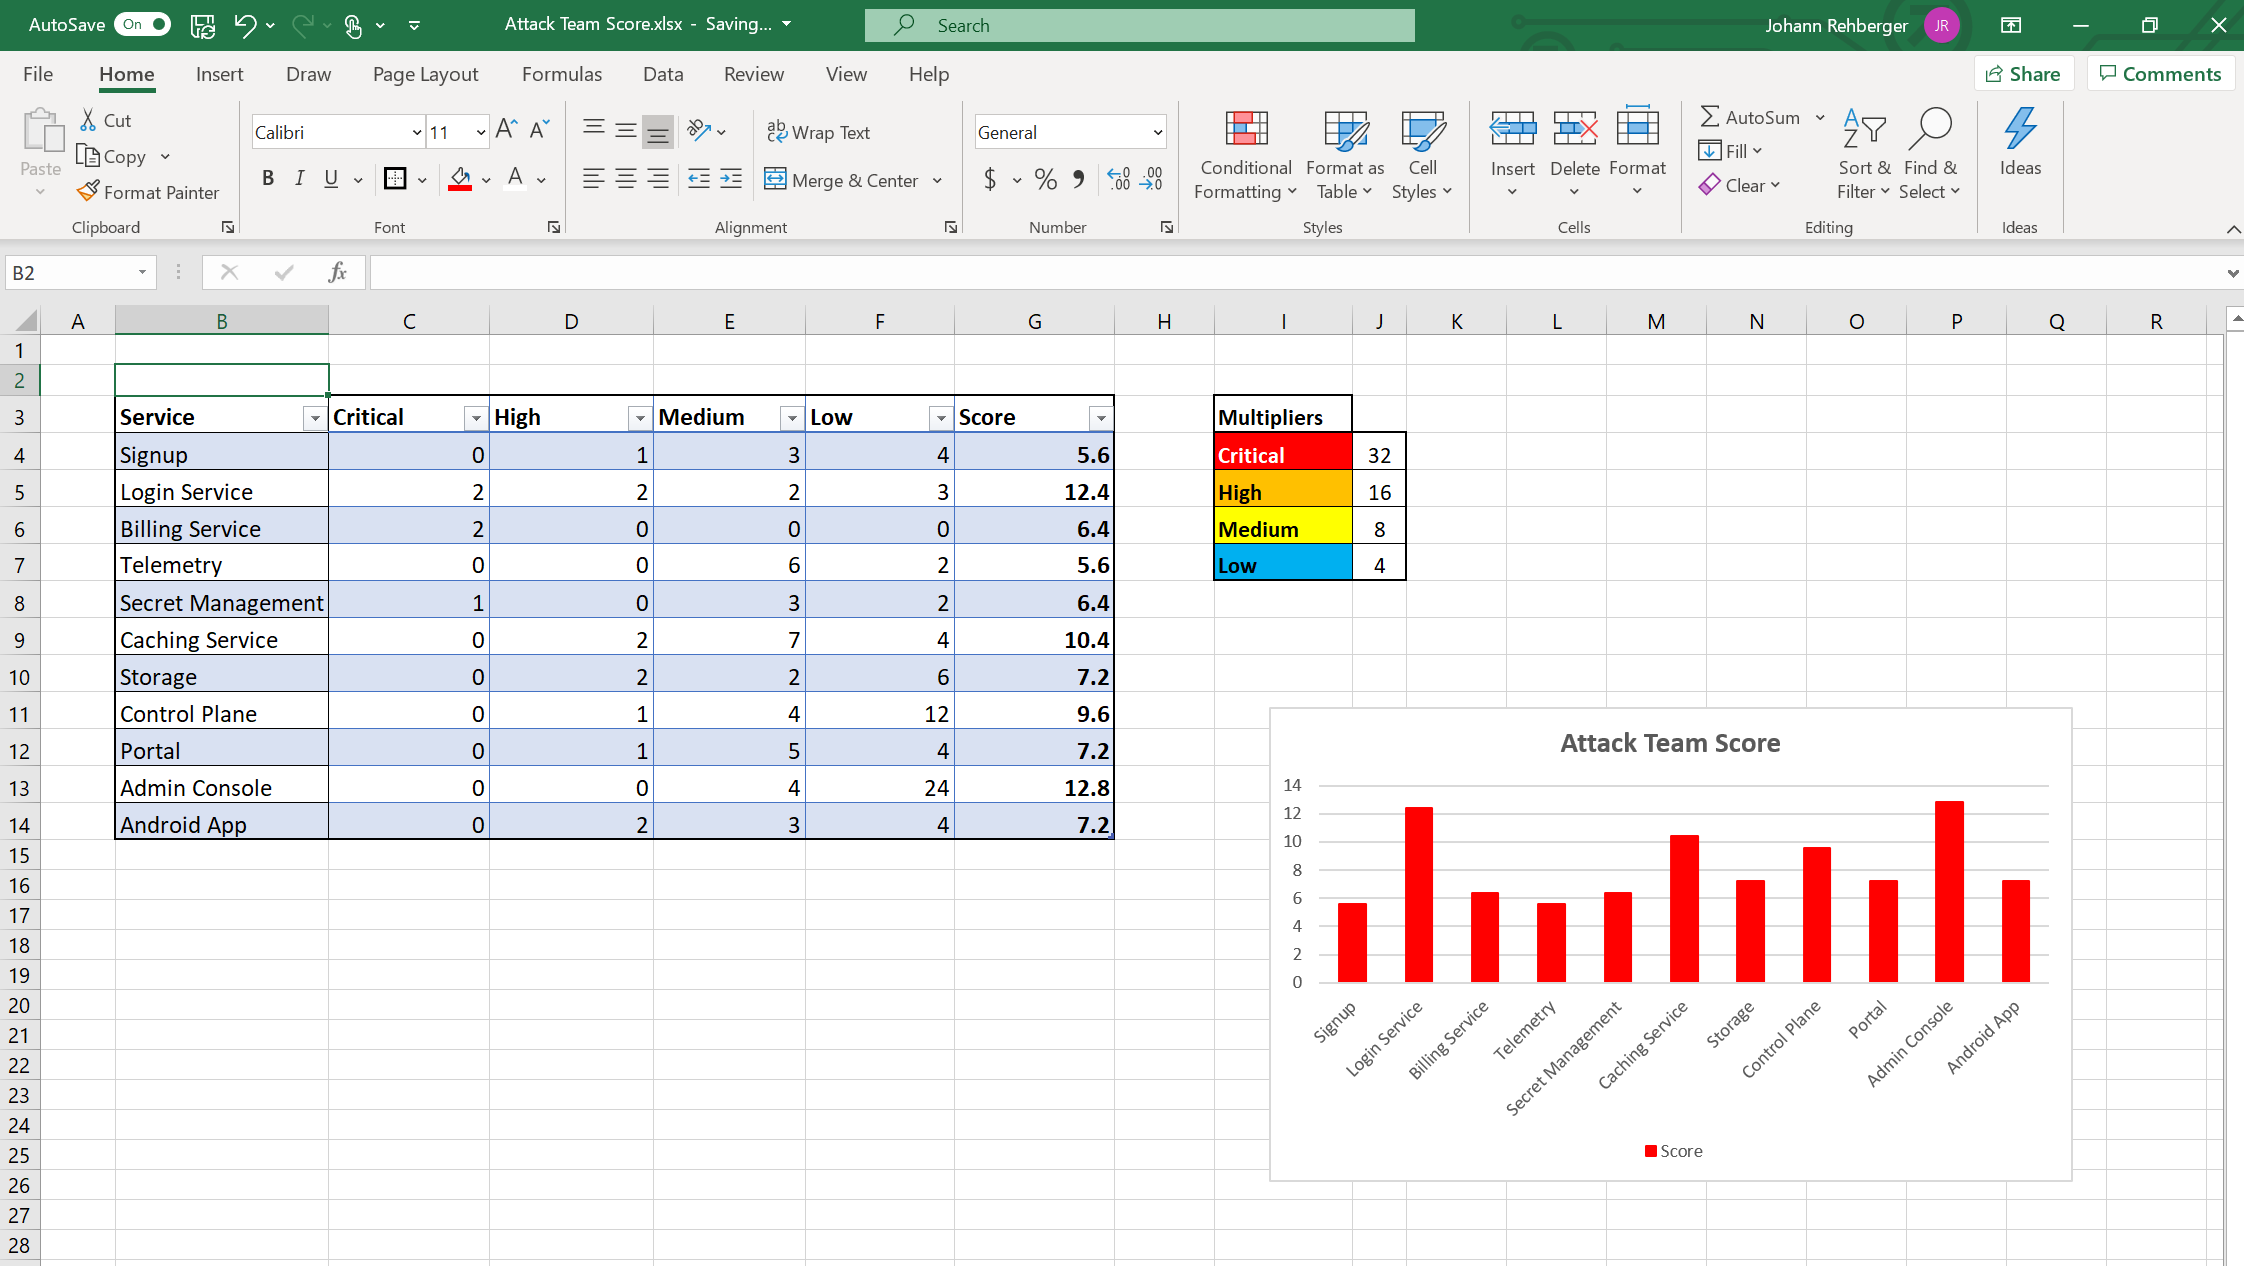
The following are the steps to build a simple chart with a score:
- Gather all services/products/teams (whatever the areas for comparision should be)
- Gather all security bugs for those identified areas. If you are not tracking security issues, you have a bigger problem that has to be tackled first. You can also include past issues and play around with various datasets. This can also be limited to issues idenfied by red teaming to make it specific to how the issue was identified.
- Using your favorite BI tool (Excel, PowerBI, Tableau, whatever floats your boat) import the data
- Introduce a multiplier (a scaling component) which rates Critical issues exponentially worse compard to High, and so forth. This is something you can play around with.
- Finally multiply the number of issues per category with the multiplier and sum them up. Feel free to scale the value down. Now you have a score!
- Create a chart and start analyzing.
The cool thing about this is that it allows teams that have many low severity issues to show up in the chart as well - in case they have a lot of them. But it means more severe issues are boosting a teams “attack team score” much further.
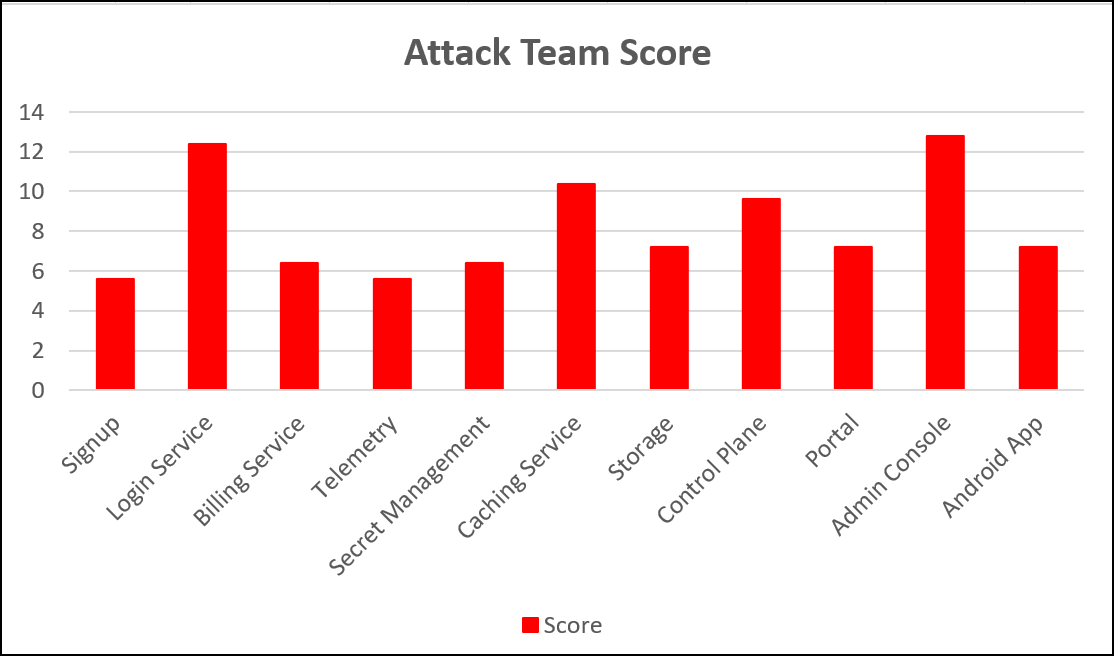
Here is an example how this looks like in Excel:
There are a lot of additional things to add and consider when building such a model, in particular considering an input variable that highlights the “business value” of a system or service to be considered in the calculation. You might also find my post about Monte Carlo Simulations and Red Teaming useful.
I hope that this simple example gives you a good idea on how to highlight red team and security assurance findings by gamifying security and creating scores to show on a dashboard.
Cheers, Johann.
Twitter: @wunderwuzzi23