Red Teaming and Monte Carlo Simulations
Monte Carlo simulations can be a useful tool to uplevel your red teaming skills and provide a different and fresh perspective for highlighting, discussing and presenting findings.
Red teaming is about challenging an organization. This includes analyzing business processes and methodologies, including our own.
Obviously, using Monte Carlo simulations in the security realm is not my idea. I first ran across the idea in Hubbard’s book about measuring cybersecurity risk. Since then I have been thinking and playing around with applying these methods to security program’s, especially red teaming and threat modeling.
What is a Monte Carlo simulation?
At a high level, Monte Carlo simulations allow to model the outcome of uncertain events.
Uncertain events such as me indeed visiting Monte Carlo one day:

But, hang on, maybe I could retire there…
Retirement planning with your advisor
If you ever did retirement planning with your financial advisor, you have seen a Monte Carlo simulation in action.
By taking a wide range of inputs, goals and probabilities a Monte Carlo simulation takes many random samples out of these values to create a model of potential future outcomes. You can modify investments, retirement age and immediately see how these changes would impact the outcomes.
Unfortunately, such simulations keep highlighting that it seems very unlikely for me to be able to retire anywhere in Monaco.
How does this apply to threat modeling or red teaming?
Old school severity ratings and scores
To set the stage, let’s first look at the traditional way security programs and red teams try to measure the impact of vulnerabilities. Usually programs leverage a security bug bar and/or CVSS scores to assign ratings to vulnerabilities. This helps to shine light on the most problematic issues, and to assign resources quickly to implement mitigations. Its a framework that allows discussion and prioritization, but it lacks important aspects to make consistent and the best possible decisions.
What about the business context of a vulnerability?
Traditional models often use ratings such as CVSS scores. The problem with those is that they lack the appropriate context to make the best decisions on where to allocate resources. This includes a lack of business context and the financial implications a vulnerability or threat has to the organization.

CVSS scores have to be seen in isolation, in their own little sandbox, they can’t easily be compared with each other.
They also don’t compute well. For instance, two Medium 5.0 scored vulnerabilities can’t be added up to state that there is a Critical 10.0 vulnerability.
CVSS is great starting point to describe a vulnerability by itself, at its technical core. However, the score has little todo with the actual severity or impact the vulnerability has to surrounding systems, the organization and it’s business.
This means by themselves these traditional techniquess and rating systems provide limited value when modeling the security posture to enable the best possible resource allocation.
Let’s explore how a Monte Carlo simulation can aid in presenting red teaming findings by augmenting an attack graph with additional data points, including financial implications.
Measuring the financial impact of a vulnerability
Imagine the following statement during a bug triage:
In the next three months there is a 40% chance that this Cross Site Scripting vulnerability will be exploited. If that happens it will cost the organization between $1000-$90000.
You might immediately object and say that such a triage is flawed. And that its not possible to measure or predict probabilities or future financial implications of a vulnerability accurately.
This is where the Monte Carlo simulations come into the picture, they help us to navigate this complexity maze and model possible outcomes of uncertain events.
Show me the money!
Interestingly, over the last two decades the security industry already moved towards a framework that associates vulnerabilities with monetary value in the form of bug bounty programs.

For instance, Facebook just paid out $20000 for a Cross Site Scripting vulnerability.
Other companies might set the value of for an XSS lower, but stakes might also be much lower compared to Facebook’s - which is exactly what the discussion should be about.
Recently, I received a $3000 payout from Mozilla for reporting a vulnerability. (shameless self-promotion :))
What does this mean though?
This means there is already a framework established in the industry that we can leverage.
Bug bounty payouts should probably be seen at the lower end of the actual cost of such a vulnerability. At the higher end we have the actual exploits, breaches and costumer data that might be stolen and regulatory fines that come with breaches.
These considerations can help guide towards an upper boundary for predictions when performing Monte Carlo simulations to model the potential financial loss due to security vulnerabilities.
Attack Graphs, Threat Modeling and Monte Carlo Simulations
In this section I’m going to apply Hubbard’s approach and basic substitution methodology to a basic attack graph in order to run a Monte Carlo simulation.
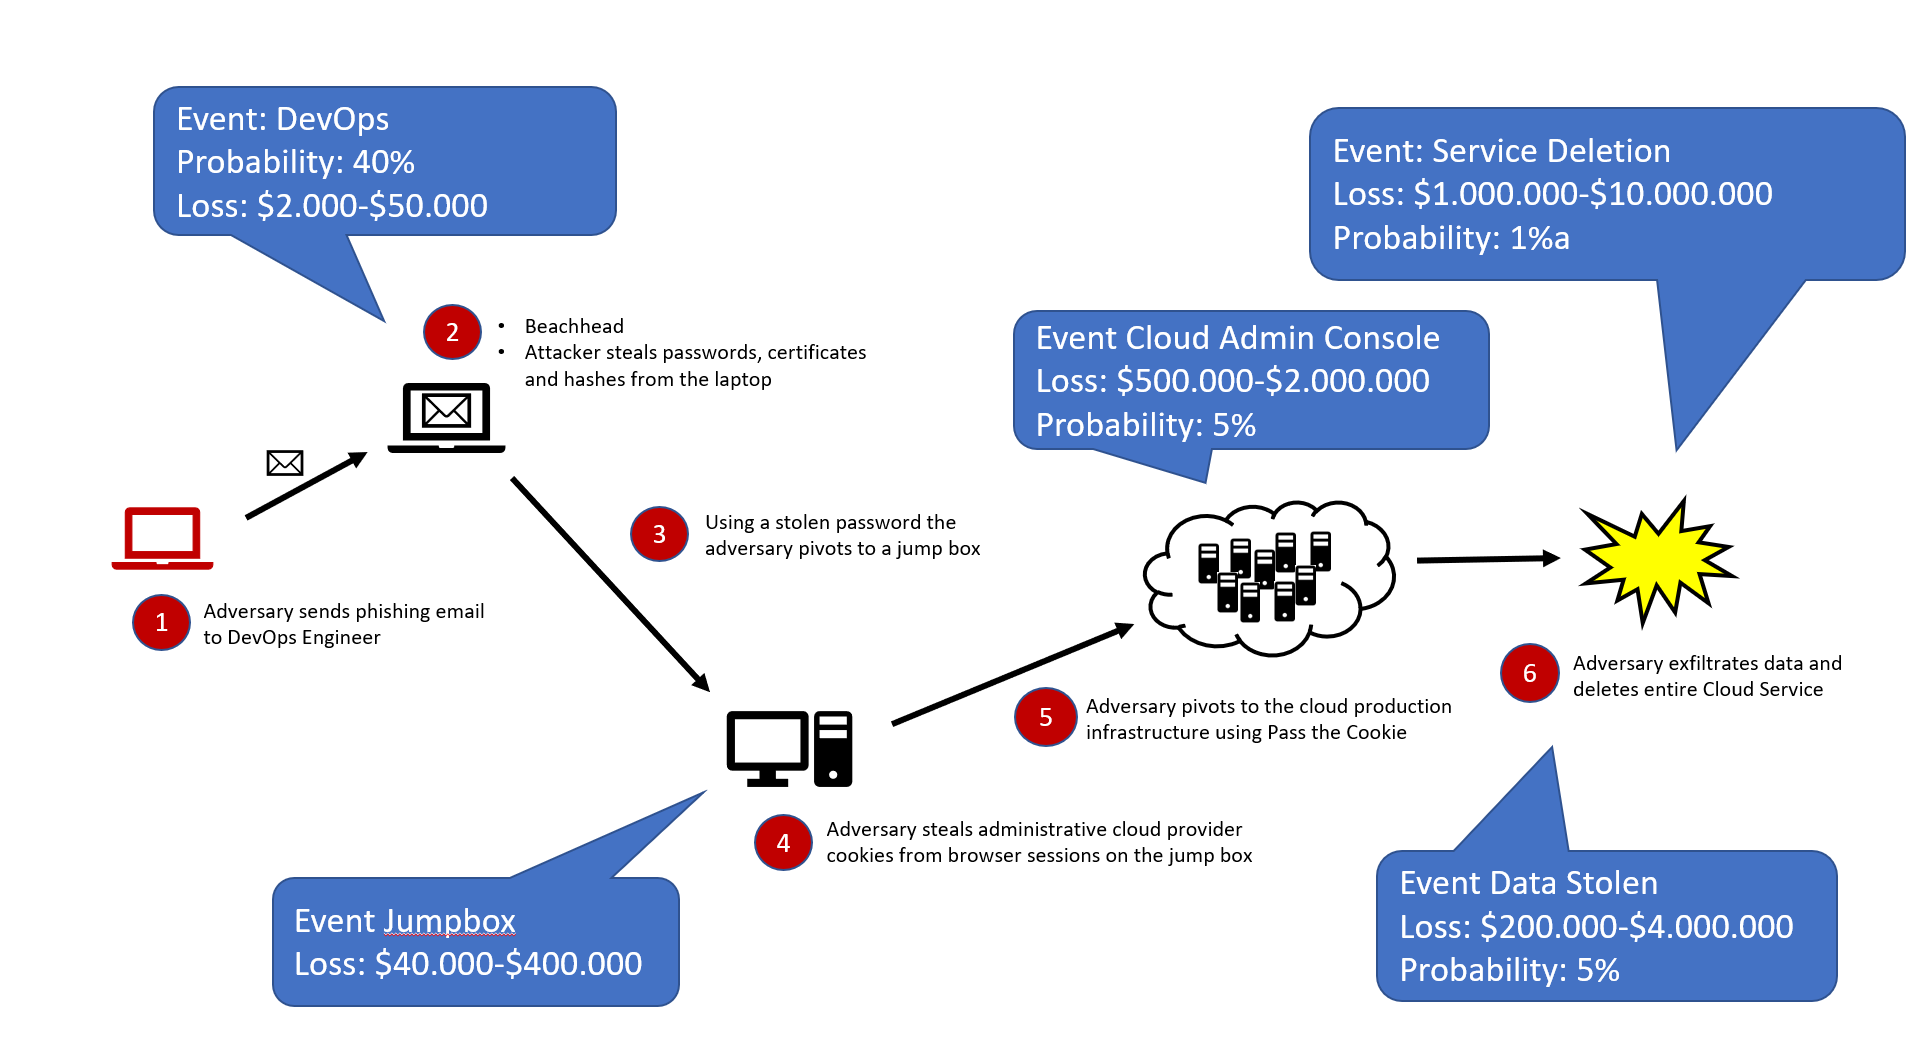
A practical example is to use the following steps for each identified threat:
- Assign probabilities of the event occurring over the next year (can also be a shorter timeframe)
- Assign lower and upper limit for financial loss in case the event occurs (using a 90% confidence interval)
- Hubbard suggests having at least five experts perform steps 1-2 and to take the average as a good enough starting point
The following image shows how this could be visually presented:
We can use Excel’s What If Analysis to perform a Monte Carlo simulation using the modeled probabilities and estimated financial loss per threat. Hubbard provides an Excel template file for download, if you want to play around with these ideas.
The following screenshot shows the outcome of a such a simulation for the attack graph:
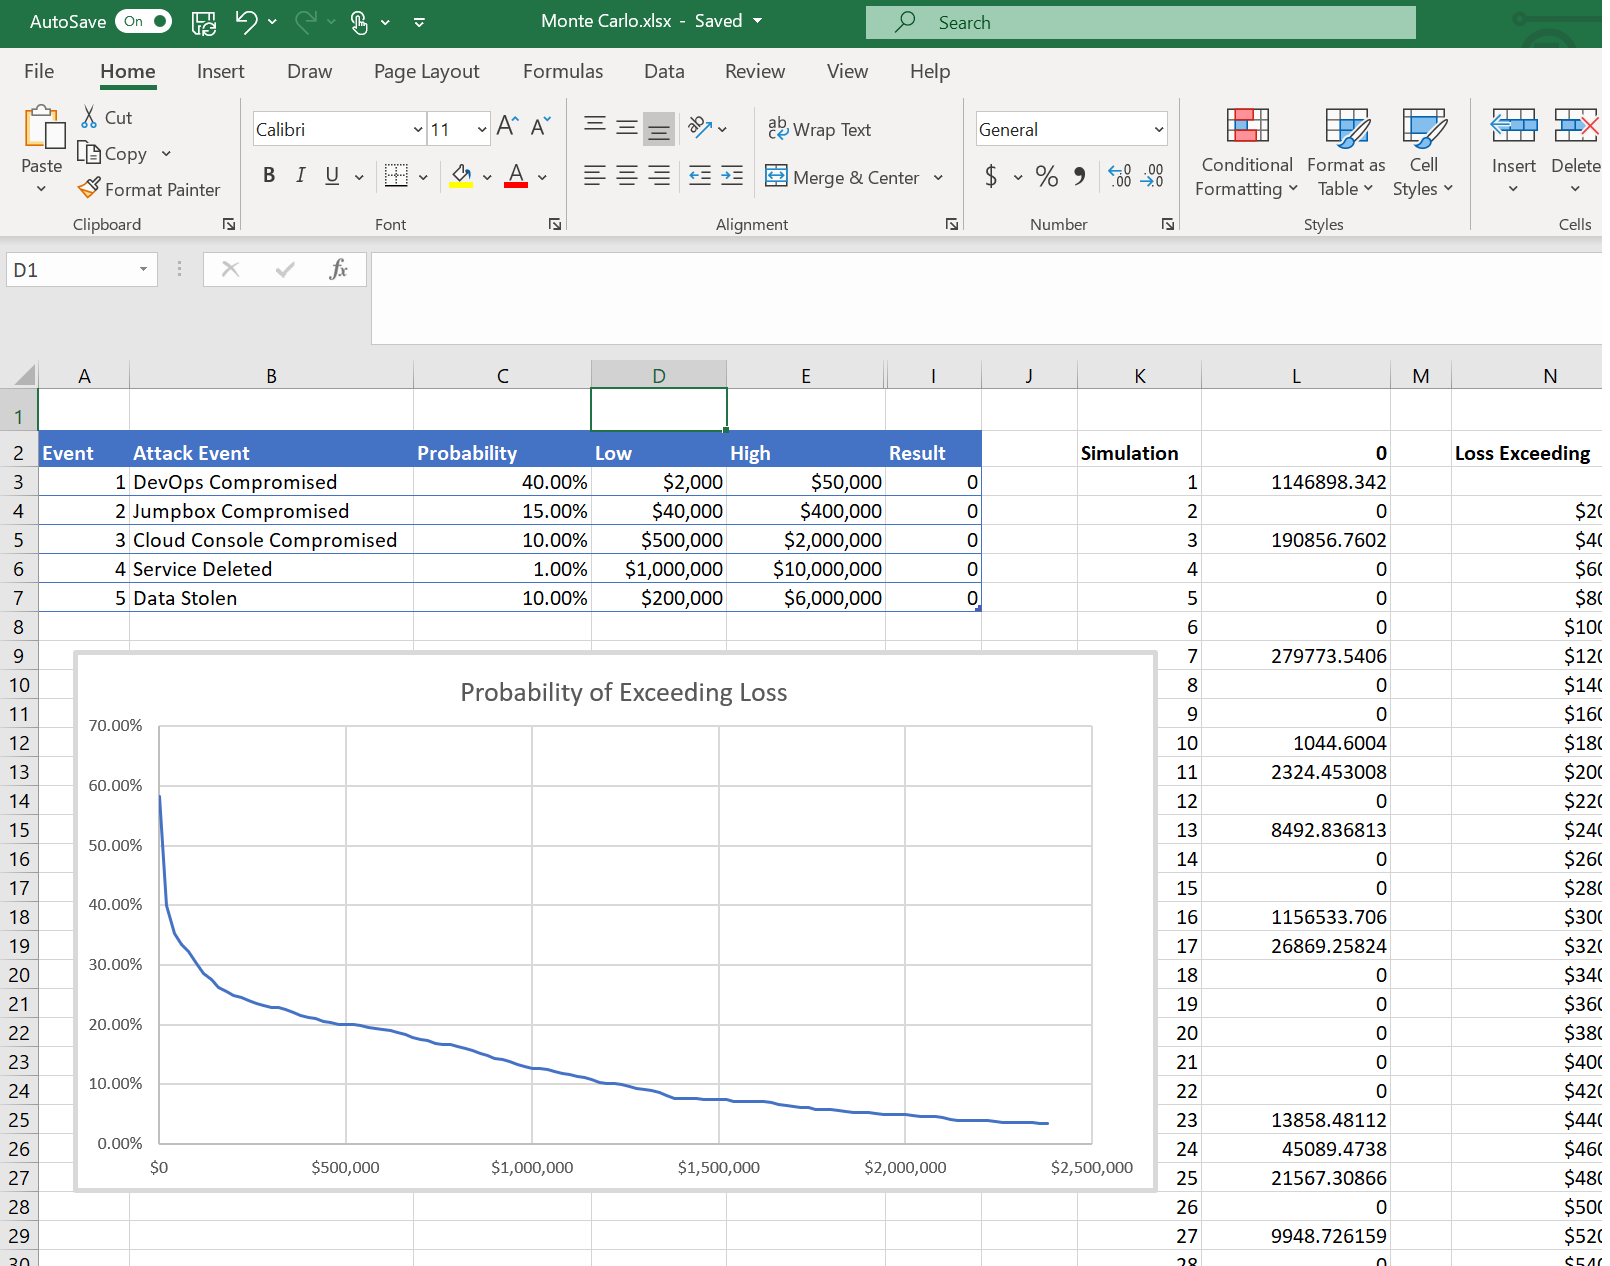
The simulation shows that there is approximately a 20% chance of losing $500000 over the next year for this system and the identified threats.
This gives business decision makers a much better understanding around the potential damage lack of security investments can have to the organization. And they can make more informed decisions.
With requirements such as GDPR, adding appropriate financial implications can educate leadership to take action and invest in areas to limite exposure and mitigate risks.
But wait, isn’t this too detailed?
There is a fair point to be made if an analysis on a individual vulnerability level is too detailed, too much in the weeds. At this point the goals is to experiment and how well this technique works in modeling exposure over time and help improving our understanding of risks.
Conclusion
In this post we highlighted some ideas on how to use Monte Carlo simulations to better model threats. The idea is to move towards discussing financial implications of identified threats and vulnerabilities, rather than purely depend on a technical scoring system.
If you found this post interesting or inspiring, my book Cybersecurity Attacks: Red Team Strategies has an entire chapter on measuring a red team program and red teaming results.
Also, feel free to follow or DM me on Twitter: @wunderwuzzi23
References
- How to Measure Anything Cybersecurity Risk Book, Hubbard
- $20000 Facebook DOM XSS https://vinothkumar.me/20000-facebook-dom-xss/
- CVSS - https://www.first.org/cvss/
- Royalty Free Images - (no attribution required, still providing reference though - retrieved 6/9/2020)