Remotely debugging Firefox instances
Previously I talked about remotely debugging Chrome, and we also covered the latest Microsoft Edge browser along the way.
These features allow an adversary to gain access to authentication tokens and cookies. See MITRE ATT&CK Technique T1539: Steal Web Session Cookie as well for this.
What about Firefox?
For a while I was wondering if (my favorite) browser Firefox has such debugging features as well, and how one could detect malware trying to exploit it.
This article was written a few months back, just never got to post it. So, here we go.
There is an important update mentioned further towards the end about a new getAllCookies() API that was just introduced by Mozilla. This should mean that one can grab cookies post-exploitation a lot easier - I will post about that seperately after looking at it in more detail.
Remote Debugging Command & Control UI
The cool thing is that Firefox comes with a built-in UI for debugging multiple remote browser connections. One can choose and switch between them:
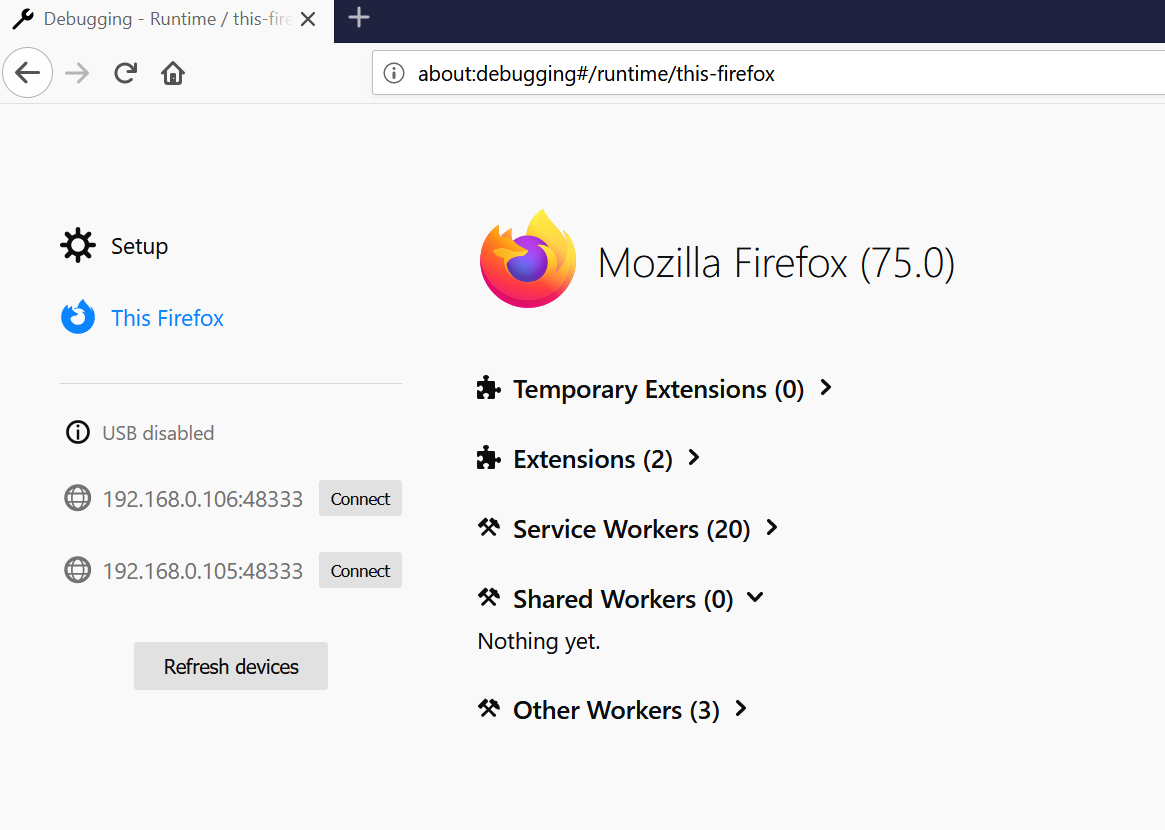
See the Connect button? It allows to connect and debug those remote Firefox intances!
How to get there?
Let’s start with the basics first.
Enabling Remote Debugging in Firefox
Unlike Chrome, Firefox disables this feature by default!
So first, malware would have to enable it by updating user.js file (or prefs.js) configuration files in the user’s Firefox profile.
On Windows the files are located at:
$AppData\Roaming\Mozilla\Firefox\Profiles\*.default-release\
Note: There might be multiple profiles present in the folder.
These are the updates that are required to enabled remote debugging:
user_pref("devtools.chrome.enabled", true);
user_pref("devtools.debugger.remote-enabled", true);
user_pref("devtools.debugger.prompt-connection", false);
These updates the remote debugging features, and disables security prompts the user would normally see by default.
You can find the corresponding configurations under Development Settings:
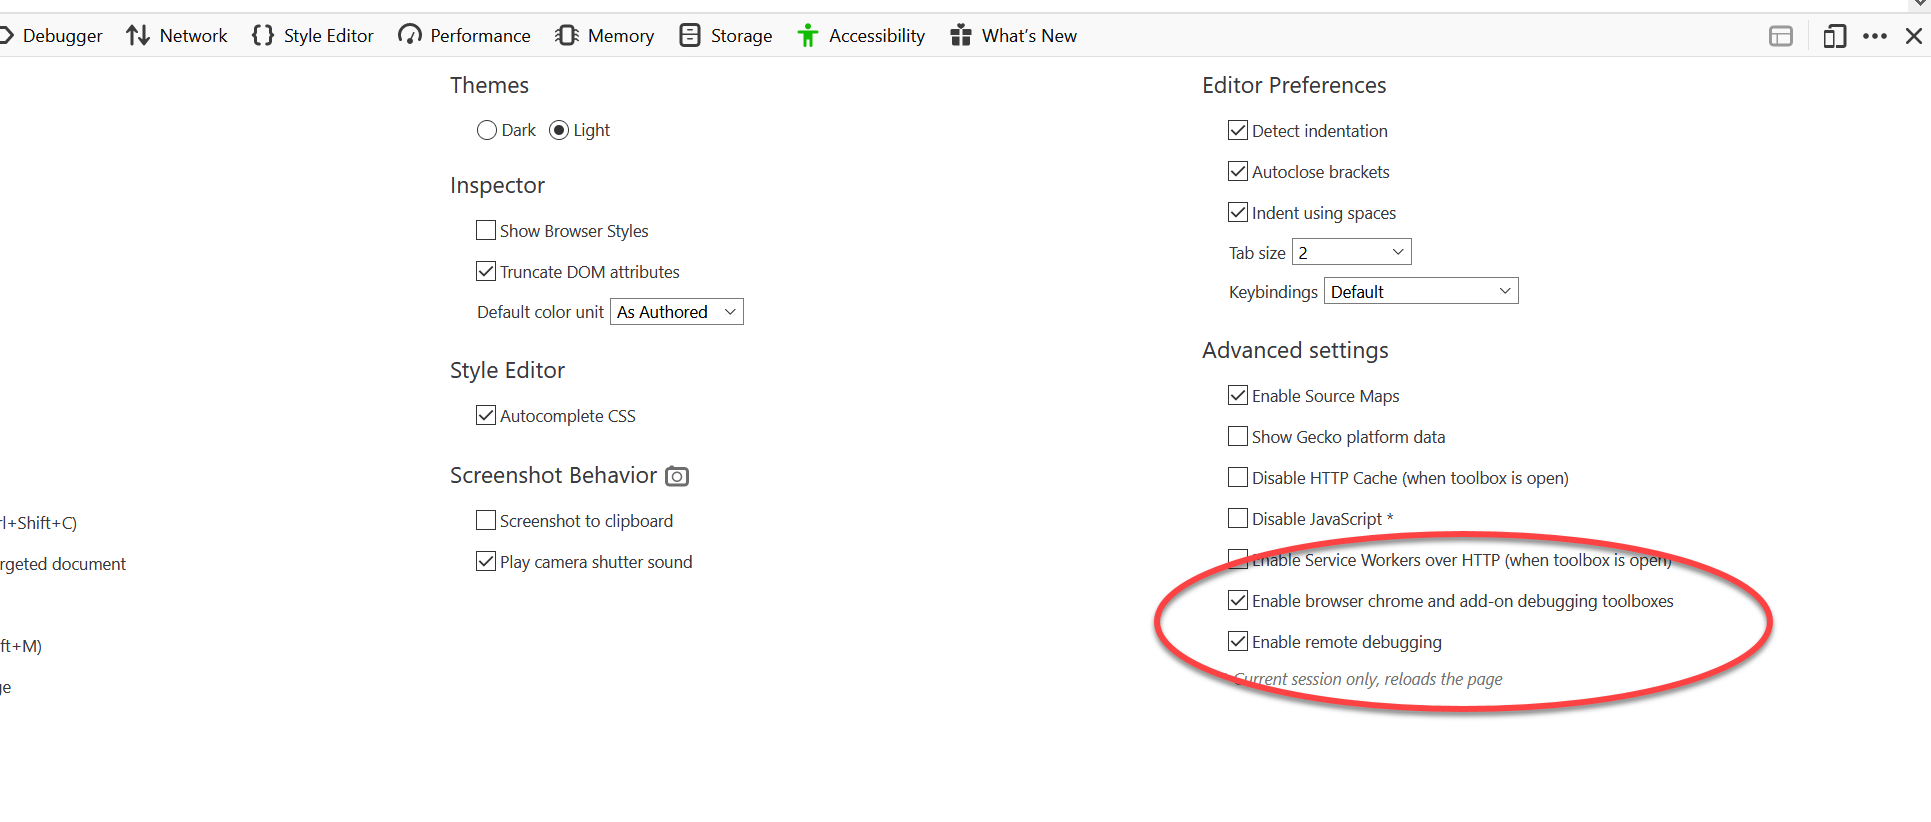
And this is how the security prompt would look like that we disabled:
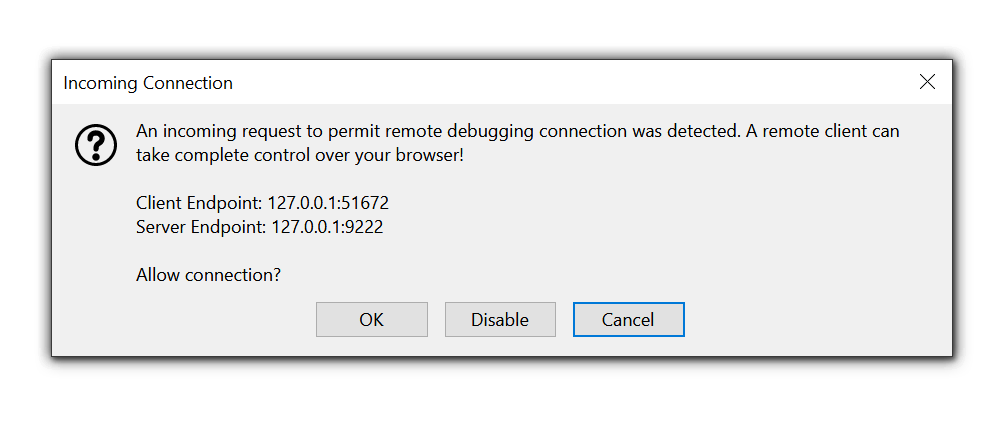
The user sees this prompt when a client connects to the debugging endpoint. The devtools.debugger.prompt-connection setting in the configuration file controls this behaviour.
Blue Team Detection
This is a great place for blue teams to add monitoring and detections to catch and alert on malware that would modify the settings to enable the features.
Using Firefox Remote Debugging
After updating the configuration, one can launch a new instance of Firefox using:
& 'C:\Program Files\Mozilla Firefox\firefox.exe' -start-debugger-server 9222
There are also the options for --headless and so forth that you can experiment around with.
This is how it looks like:

As you can see, this only listens on the local interface.
Tunneling traffic to remote machines
The debugging port is only available locally, an adversary will try to make that remotely accessible via port forwarding. I talked about this here in a bit more detail, but below are the basic commands needed.
In Windows, this can be done by an Administrator using:
netsh interface portproxy add v4tov4 listenaddress=0.0.0.0 listenport=48333 connectaddress=127.0.0.1 connectport=9222
Now, remote connections to this port will not be allowed because the firewall blocks them (we forwarded to port 48333). We have to add a new firewall rule to allow port 48333. So, let’s allow that port through the firewall.
There are multiple ways to do this on Windows, but since we already used nets let’s stick with it:
netsh advfirewall firewall add rule name="Open Port 48333" dir=in action=allow protocol=TCP localport=48333
Now, it is all setup to connect to from another machine.
Important: This traffic is sent in clear text, so be aware and consider using ssh port forwarding to encrypt traffic
Debugging remote Firefox instances
Now that the debugging port is exposed remotely, we can attach Firefox on another machine to it. Let’s walk through the steps on how this works:
-
Navigate to
about:debuggingin the browser URL (or click Web Developer Tools - Remote Debugger). This is where you can connect to remote devices runnning Firefox. Click “Add” to add a new server to connect to.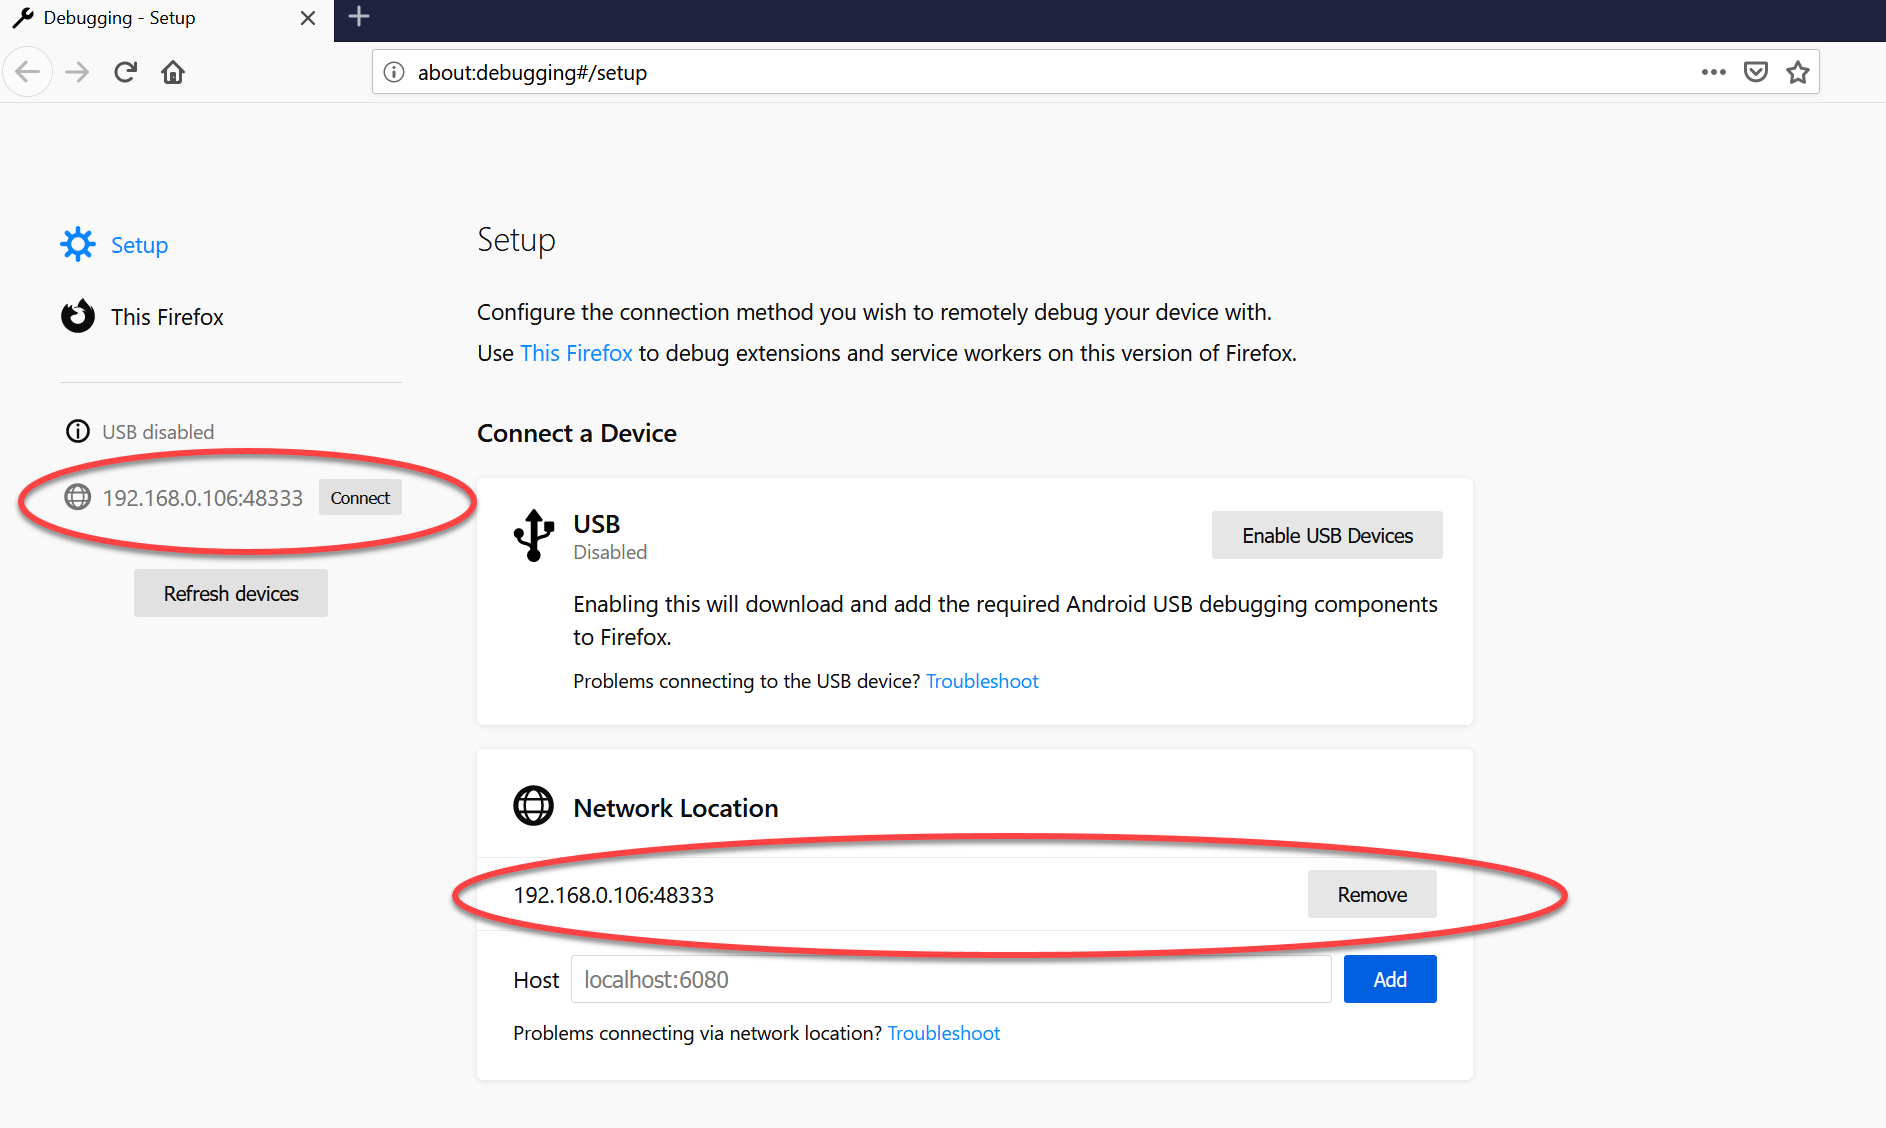
-
It is also possible to add multiple debug server as seen in this screenshot. This basically allows to have a mini C2 to remote control multiple browsers.

-
Use the
Connectbutton to connect to a particular browser instance. Once connected you can run commands in the console, navigate the user to a different page, and also inspect storage and cookies as seen in the following screenshot.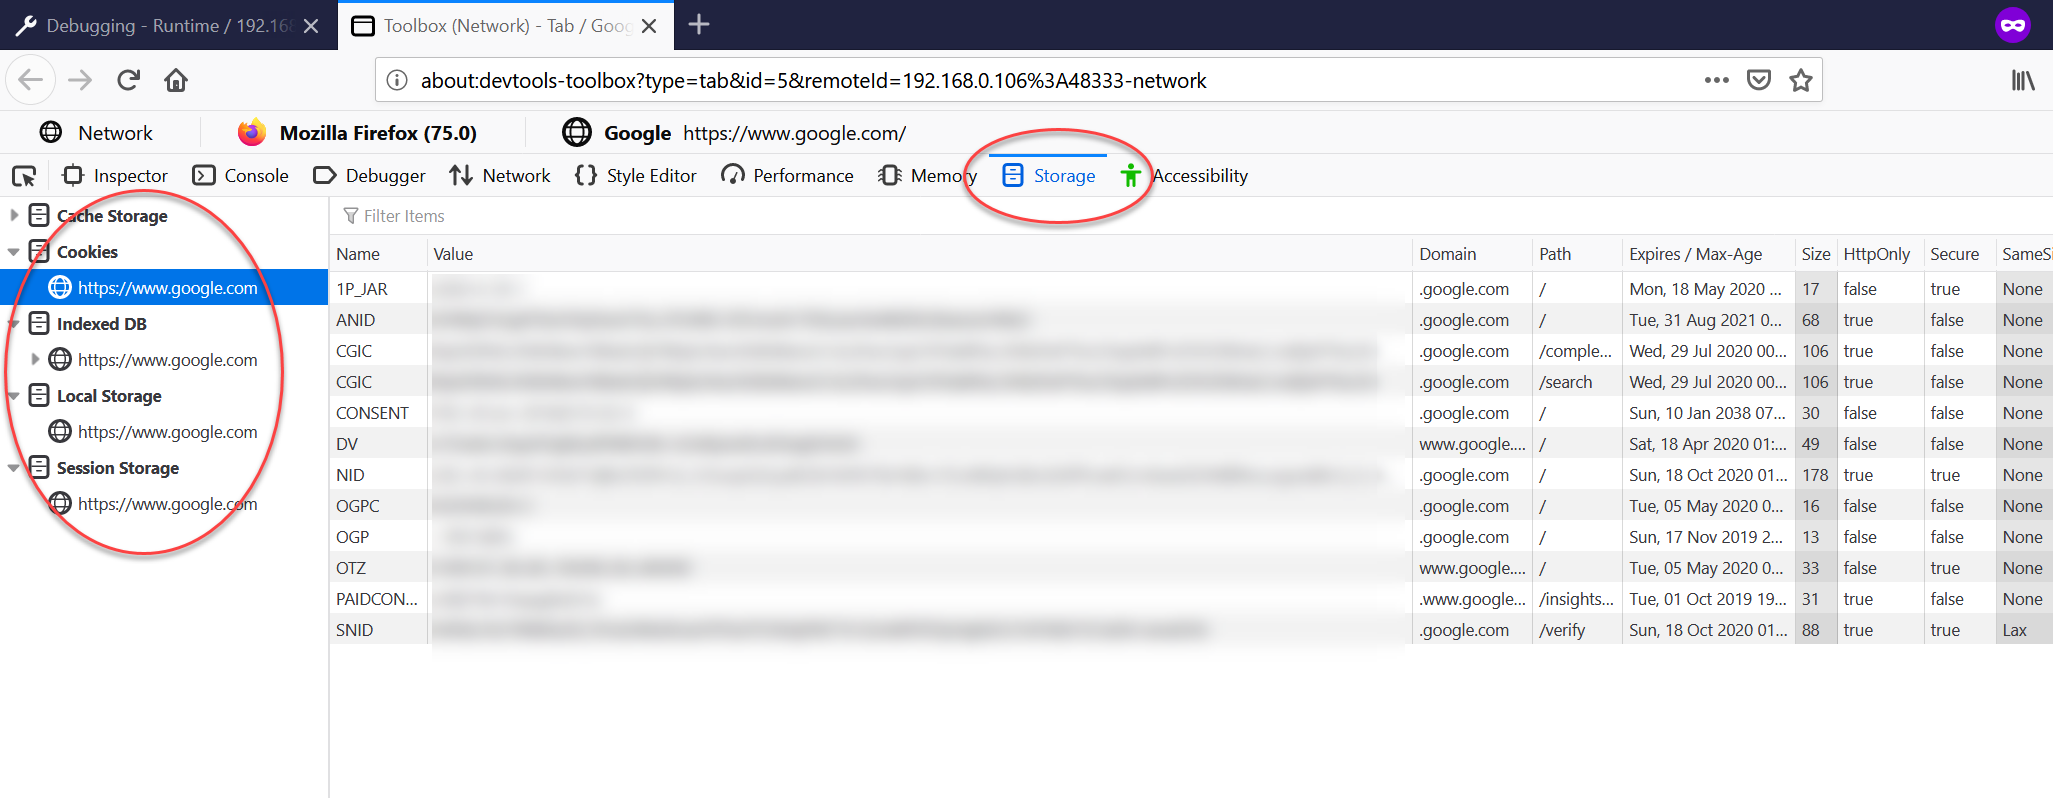
That’s it, all pretty cool I think. :)
Automation
I have not yet spent much time to research the protocol to automate this. The protocol is documented here and while digging into this in more detail, I ran across this Bugzilla defect:
Yes, this means Firefox will also implement the Network.getAllCookies() API - similar to how it works today with Chrome via Cookie Crimes.
Here are some basics about the protocol that I was able to figure out. I kind of got stuck here, when researching this and thought to just wait until Firefox has the proposed API.
The default protocol is a simple one, it consists of sending length:JSONREQUEST.
Connect via telnet or netcat, and send the following strings in:
30:{"type":"getRoot","to":"root"}
Some other commands I figured out to get the contents of a site:
31:{"to":"root","type":"listTabs"}
57:{"type":"getTarget","to":"server1.conn21.tabDescriptor7"}
65:{"type":"listStores","to":"server1.conn21.child21/storageActor5"}
124:{"type":"getStoreObjects","host":"https://www.google.com","names":null,"options":{},"to":"server1.conn21.child21/cookies20"}
The identifiers for connections and actors (such as conn21 or child 21) change everytime, so this needs a little scripting to automate - which I have not worked on.
I will be waiting for the handy getAllCookies API.
UPDATE: I just checked the Bugzilla bug again and the getAllCookies() API exists now!
This should make the job of getting cookies a lot easier.
Cleaning up and reverting changes
Keep in mind that port forwarding was set up earlier to enable the remote exposure of the Firefox debugging API on port 48333. In order to remove port forwarding and revert to the defaults, we can run the following command:
netsh interface portproxy reset
Alternatively, there is a delete argument.
The same applies for opening port 48333 on the firewall:
netsh advfirewall firewall del rule name="Open Port 48333"
That’s it, now what detections?
Detections and Mitigations
- Blue teams should look for anyone using the
-start-debugger-serverand related features to identify potential misuse. Be aware on Linux/macOS the argument is--start-debugger-server - Similarly, observe and monitor for port forwarding on hosts
- Monitor for changes to
user.jsandprefs.jsfiles that modify the remote debugging settings for each user and profile under$AppData\Roaming\Mozilla\Firefox\Profiles\. Malware that wants to leverage the built in features might update the files. - Usage of
netsh interface portproxyor artibrary firewall rules being opened up can also highlight anomalies
Conclusion
In this post we explored remote debugging and how it can be used with Firefox. Hope the post was informative and useful. And check back soon for a post on using Firefox’s getAllCookies APIs.
Feel free to follow or message me on Twitter @wunderwuzzi23.